by Omar Sedki, liveGAP charts

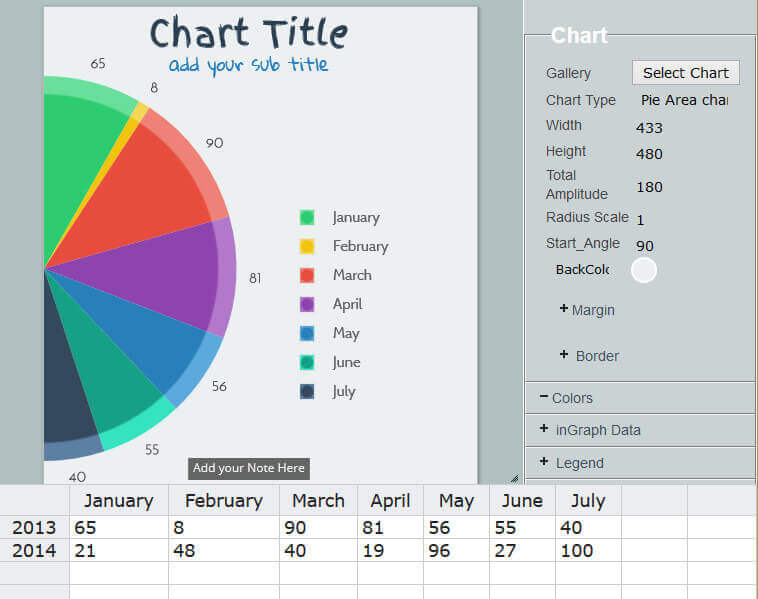
liveGAP charts is a free online chart generator you can use to produce any kind of Line – Bar- Stacked bars – Radar- Polar Area – Pie – Doughnut charts you’d like then incorporate than into your presentation or report.

How it Works
Enter The Data
- Add your data into the spreadsheet panel.
- You can also copy it from excel Or any spreadsheet.
Customize The Chart
- Modify Chart Type, Colors, Texts, Fonts, border, background,line style, axis, legend…
Save & Share
- Save Your Chart as image or as web page (animated)
- Or Save online to access from everywhere or Share with Friends.

Features
Live Preview
- Easily Create a chart from your data.
Customization options
- Colors, Margins,Texts, Legend, Fonts, Gradients…
Save Charts Online
- Access from anywhere, or use as Template
Share your Chart
- Easily Share on Facebook or as Simple Link.
Ready to Use? Click: LiveGap Charts